Finally got some time to put all the pieces together for collecting logs from across my Home Network and centralizing them for analysis, visualization.
The general setup is the following:
- Every node that generates logs will need an “agent” to send the logs to a central location.
- You need a central location that will collect these logs from across your network.
- You will need a way to query them efficiently and a way to visualize them effectively (creating timeseries/bar/pie or other charts, summarized tables etc.)
- You may need a way to transform your incoming logs so they can be processed by the “query” and “visualization” layers
In my case, I chose the following setup:
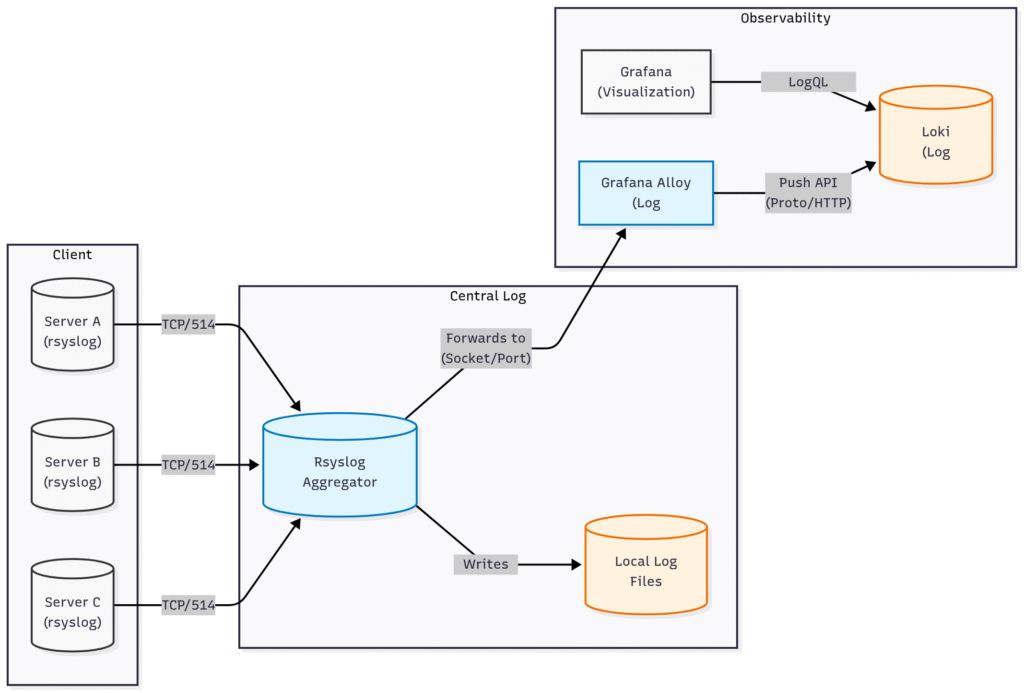
- Every node runs rsyslog and sends the logs to a central rsyslog server. You can alternatively use alloy to send the logs to a centralized location as well.
- The central log server (also running rsyslog and receiving logs from all nodes), saves them to files and forwards them to an alloy host. The rsyslog server processes the logs to add necessary fields that are helpful in queries – you can read more about how this was setup here.
- The alloy endpoint processes the logs to sanitize labels, drop high cardinality labels and forwards them to a loki instance running on the same host.
- The loki instance is connected as a data source to a grafana endpoint. Grafana is used for creating dashboards and authoring queries against the loki instance with all the centralized logs.
Here’s a visual diagram of the system with various components and how they connect to each other.
Some key things to keep in mind when you set this up:
- Loki works on the concept of labels – labels allow you to narrow down the search scope for a log query. Examples of labels can be hostname, appname etc. Labels are very useful in creating efficient queries through logs across all your hosts.
- Loki handles indexed labels by creating individual files for each unique combination of label sets.
- What that means is that if you have high cardinality labels (a label with a large number of unique values), you will quickly run out of inode space on your loki host due to the large number of small files that it will create.
- You can use logcli to find all your loki labels and understand the cardinality of your existing labels with this command:
export LOKI_ADDR="http://127.0.0.1:3100"; ./logcli-linux-amd64 series '{}' --analyze-labels --since=1h
- You can also check how much disk space you are using and how much inode space you are using (note that you may run out of inode space even though you have plenty of disk space) using the
dfor du commands. - In my case, I originally had process ID as a label. This is both not very useful and extremely high cardinality (the same service may spawn repeatedly for example) and ended up consuming a lot of inode space very quickly.
- I added a
fix_cardinalityloki.processstage in my alloy config where I added theproc_idlabel as structured metadata and dropped the label before forwarding it to loki for write. This eliminated the high cardinality label and associated problems in my setup. Here’s the stage config in alloy for removing this high cardinality label:
// We pipe logs here BEFORE sending them to Loki.
loki.process "fix_cardinality" {
  // Forward to the writer after processing
  forward_to = [loki.write.default.receiver]

  // 1: Move high-cardinality labels to Structured Metadata
  // This keeps "proc_id" searchable (e.g. | proc_id="1234") but not indexed.
  stage.structured_metadata {
    values = {
      proc_id = "", // Automatically takes the value of the "proc_id" label
    }
  }

  // 3: Drop high cardinality proc_id label
  stage.label_drop {
    values = ["proc_id"]
  }
}- Loki will automatically add a service_name label to ingested log lines that is discovered based on a default set of rules. In my case, this label is redundant since
rsyslogwill forward entries withapp_nameset appropriately andservice_nameis just a repeat of the same info. So I disabled it by adding this to my loki config.ymllimits_config:discover_service_name: [] - Loki’s ingester defaults are not meant to be tuned for a typical home network environment where most nodes produce sporadic and low volume of logs. You can adjust the settings to reduce the amount of files created by loki by tuning these sections – the first parameter dictates the maximum amount of time a chunk is held open and the second parameter dictates how long a chunk can be kept open even if no new logs were received for it:
ingester:
  max_chunk_age: 24h
  chunk_idle_period: 12h